Help Center
Accurate query entrance is provided for users to search the super-enhancer information for their concerned genome locations, genes or cell-type/tissue/diseases.
1. Table browser for datasets
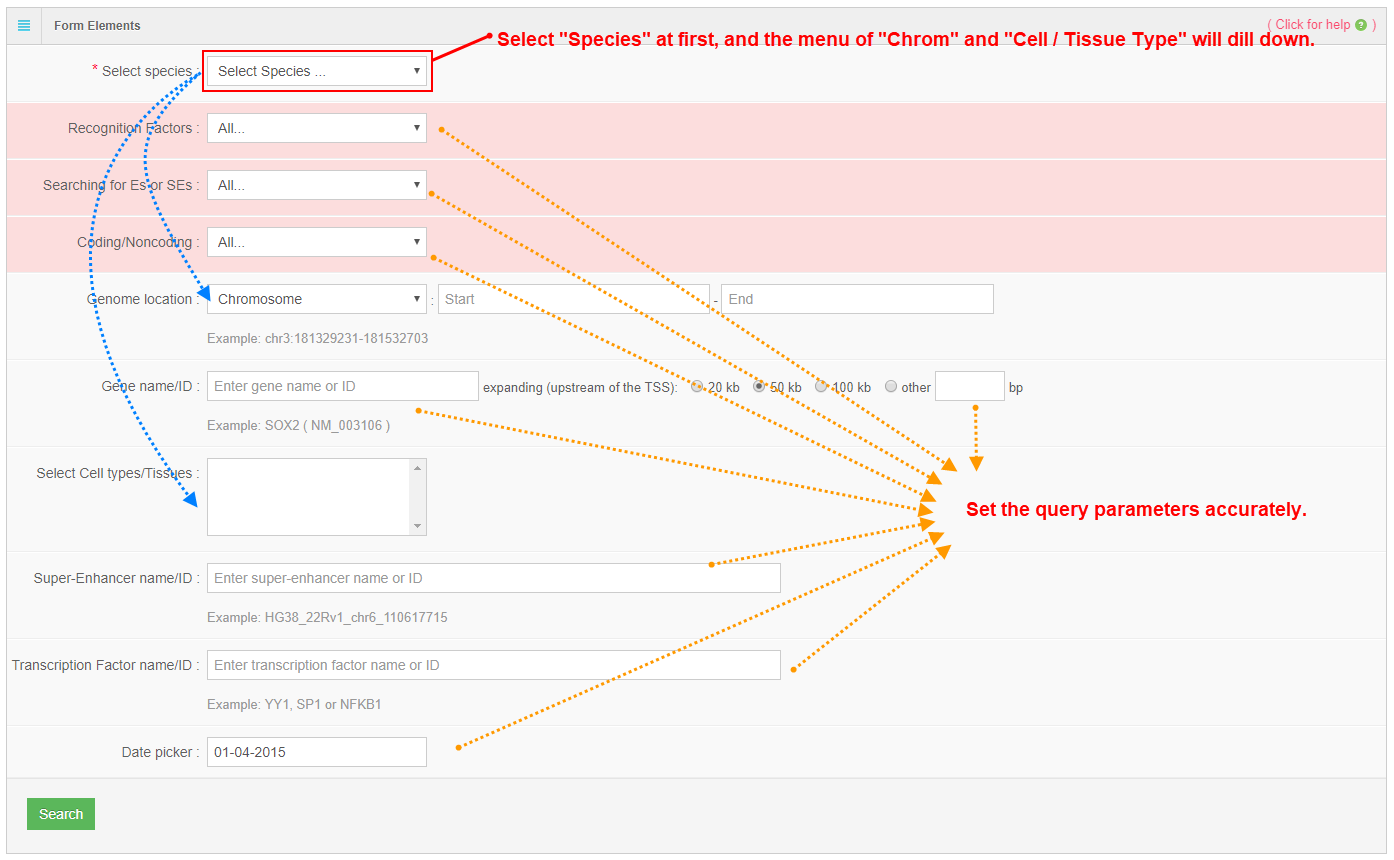
2. Advance search
In this search entrance, accurate search is supported. User can specify the detailed information about super-enhancers such as species, genome location, gene name, cell-type/tissue, super-enhancer name, transcription factor etc. The results would be showed in the tables and SEA-browser.
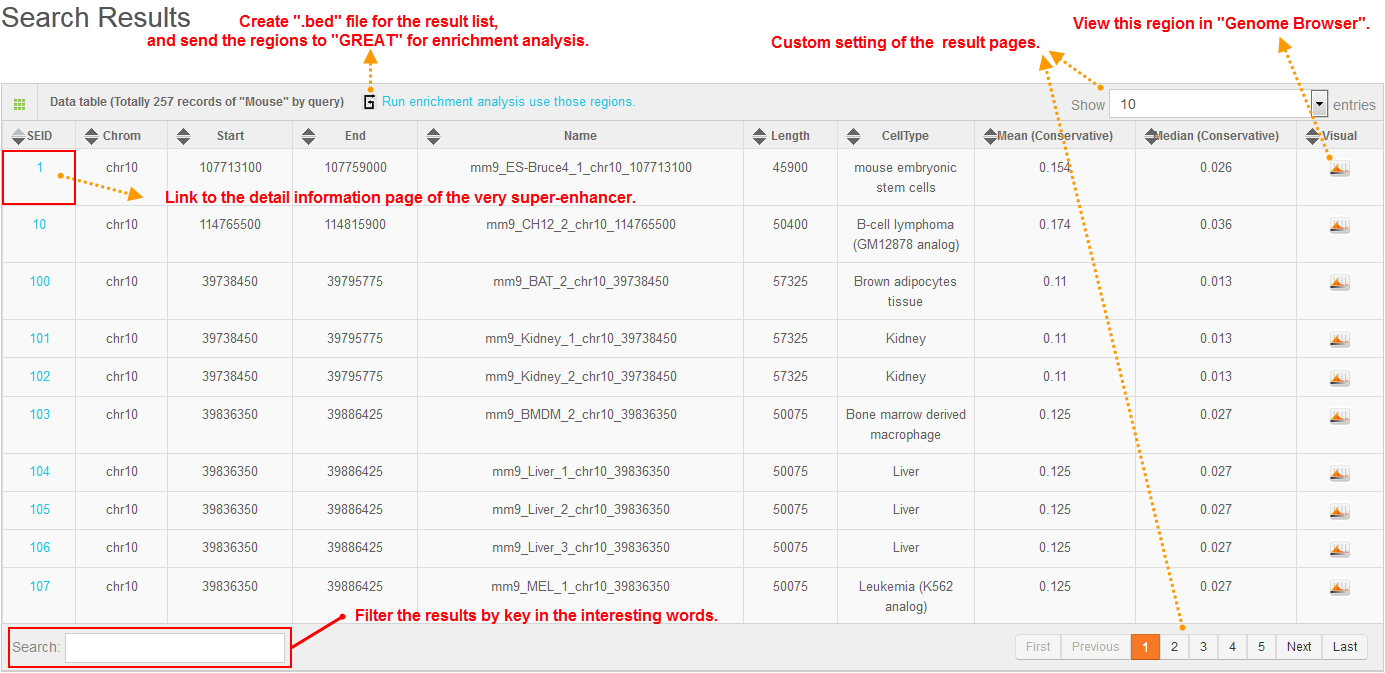
3. Search result table
The search result would be shown in table. User can see the detail information by the links listed in this table, such as the SEID for the detailed information about nearest gene, cell-type specificity and sequence conservation. The links to SEA-browser would bring to SEA-browser for visualization of these information in genomic context.
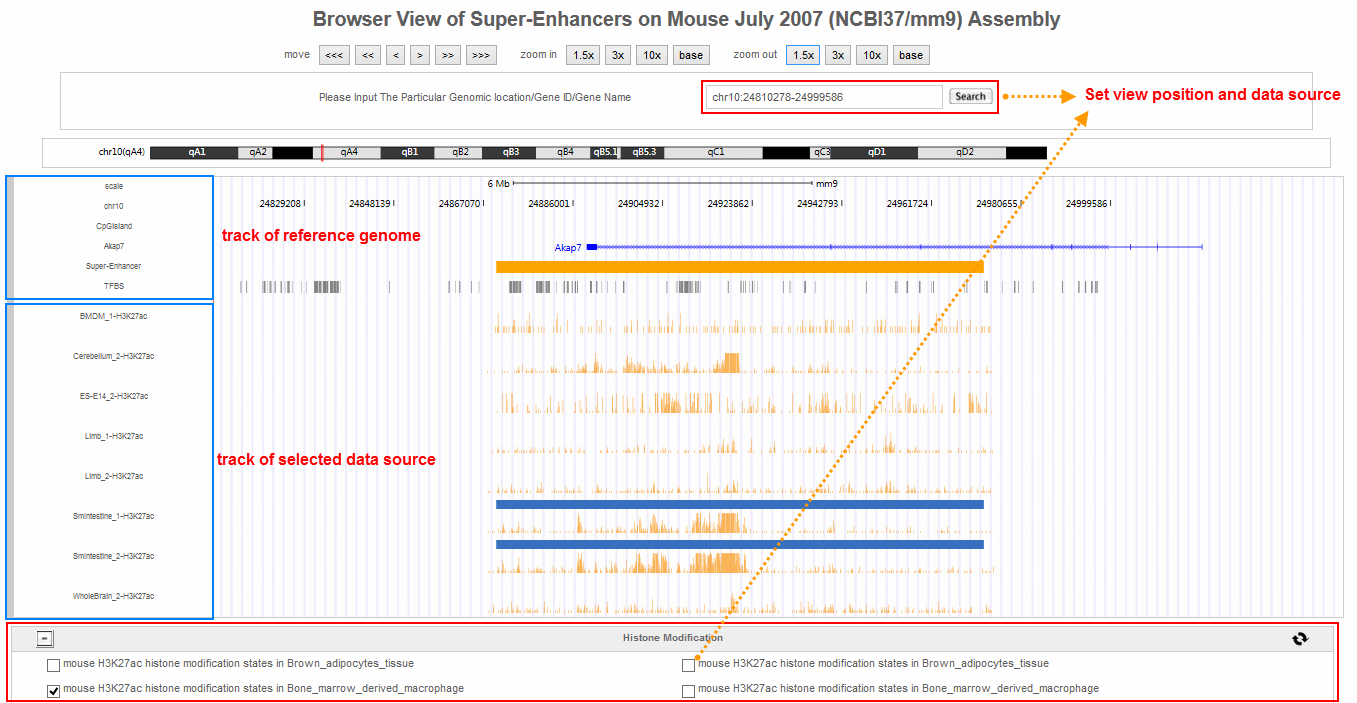
4. SEA-browser
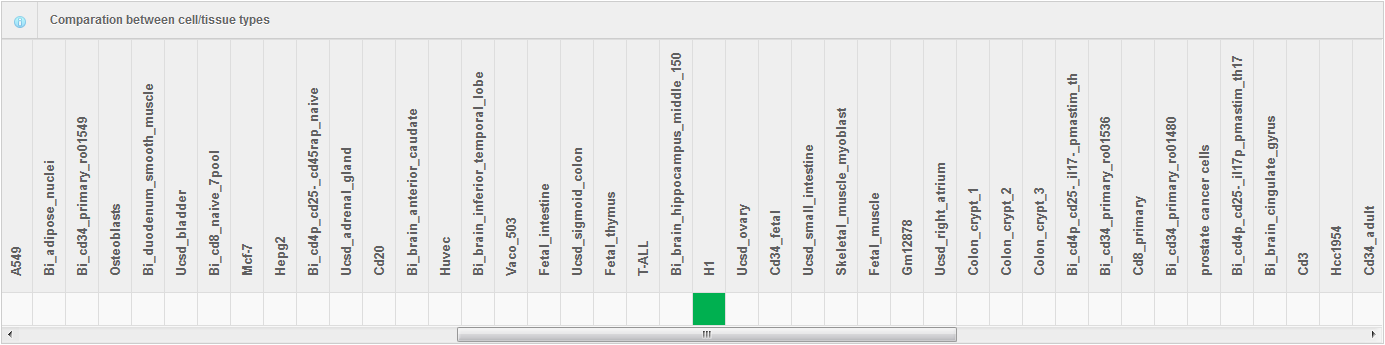
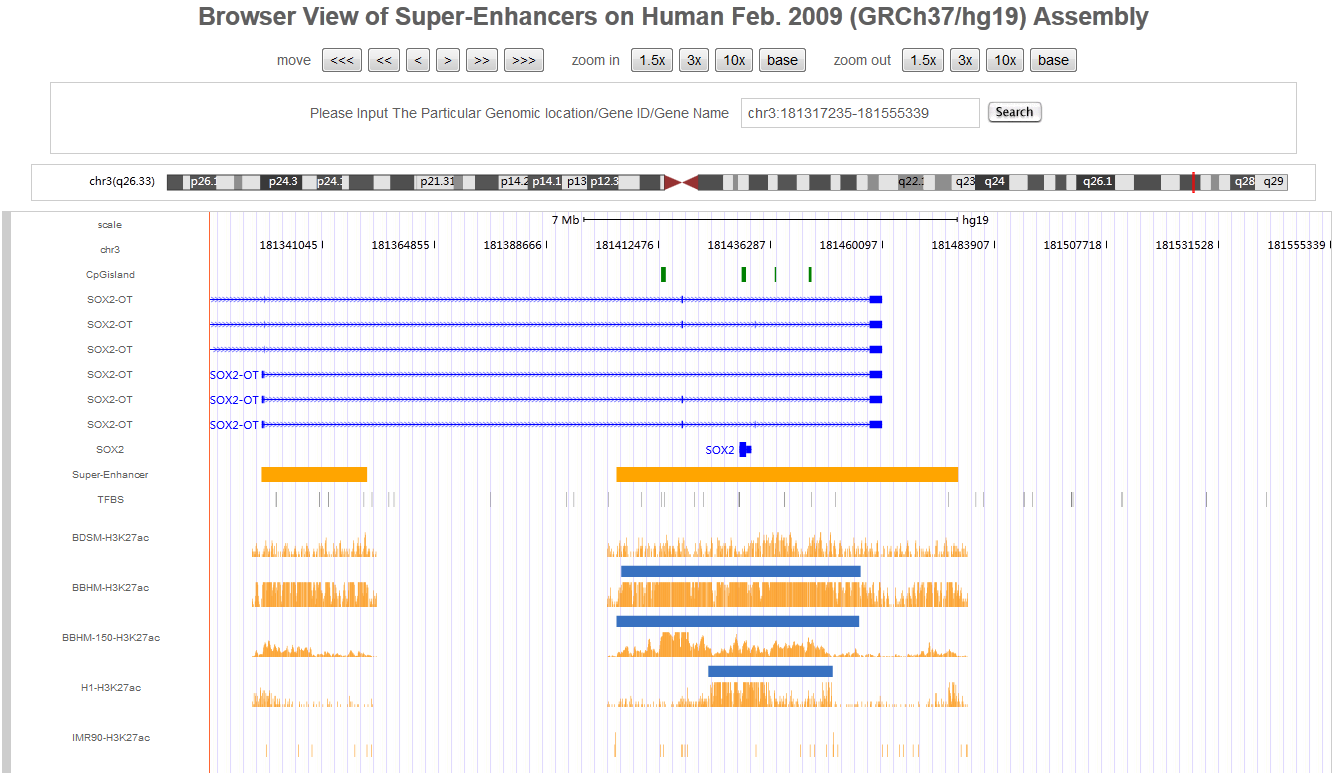
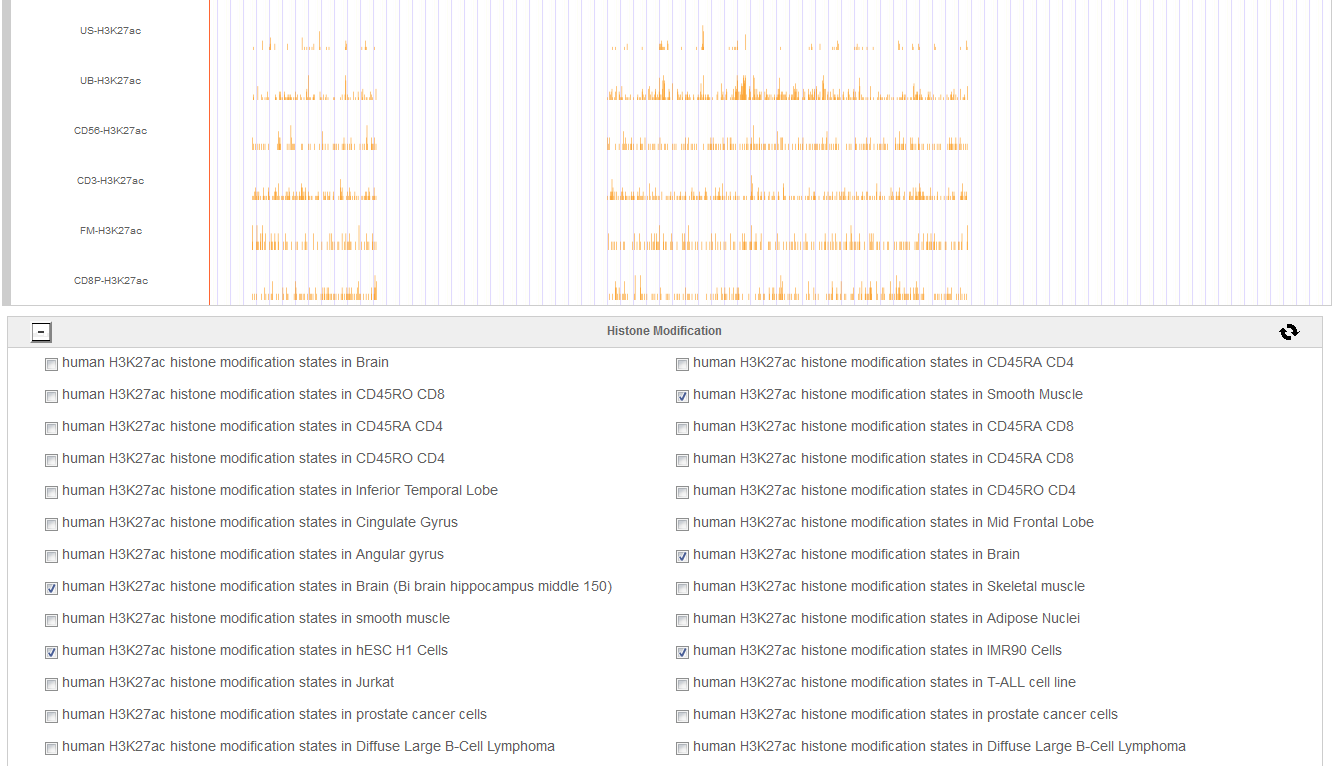
SEA-browser was developed for visualization of super-enhancer information in the genomic context. In SEA-browser, user can see the location of super-enhancer to nearby genes, transcriptional factor binding sites and the cell-type-specific super-enhancer and H3K27ac modification pattern. User can add or remove the data tracks by clicking the selector at the bottom of this pape.
5. A case study for analysis of human gene SOX2
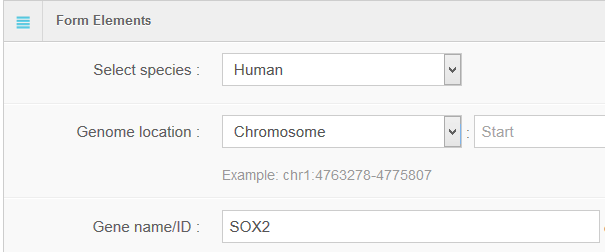
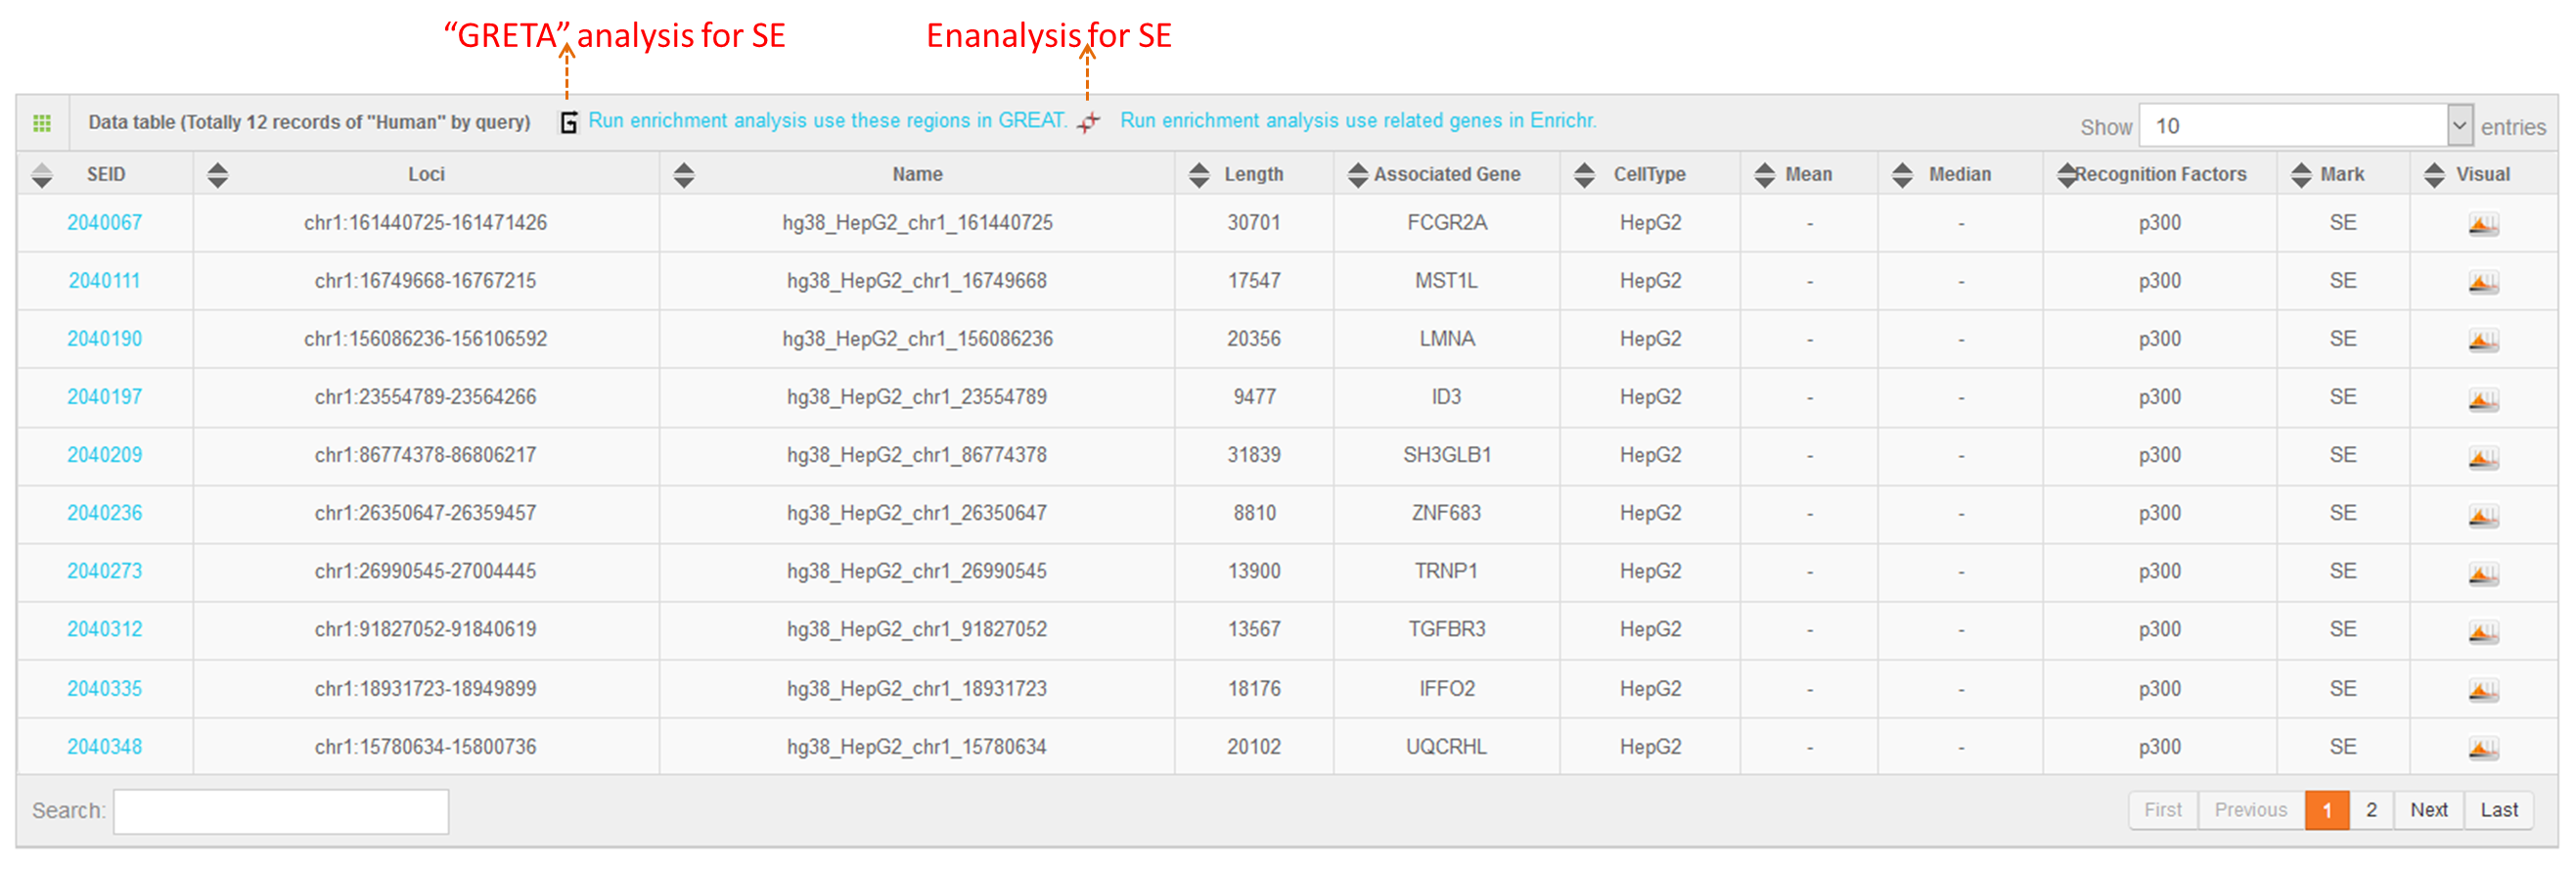
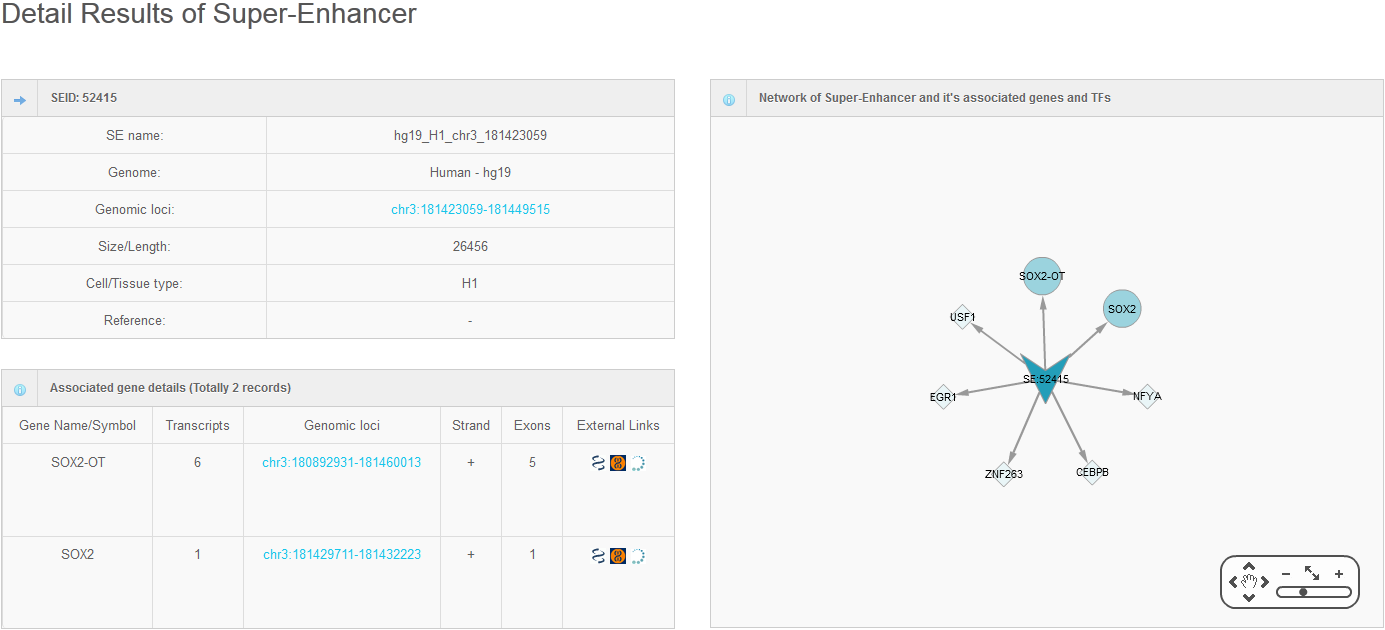
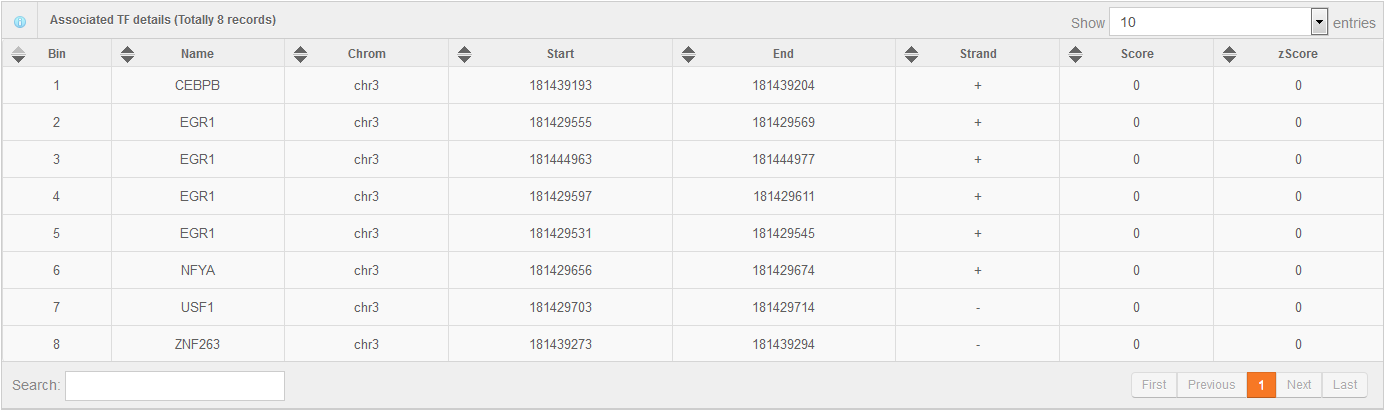
Hello every one, I am Hongbo Liu. I am interested in the super-enhancer related to human gene SOX2 which coding an important transcript factor for stem cell pluripotent. In the Advance Search page, I selected human species and input “SOX2” as gene name. After clicking the Search button on the bottom, eight super-enhancers related with human SOX2 in different cell-type/tissues are list in the search result page. It is well known that SOX2 is a key gene for stem cell. Thus, I selected the super-enhancer (SEID:30459) in human stem cell H1. Clicking the blue colored SEID, the detailed information about this super-enhancer is shown in a detailed information page. As shown in this page, there are two genes (SOX2 and SOX2-OT) nearby this super-enhancer. From the network and table, we acquired that there are 5 transactional factor binding site (including the well-known super-enhancer marks CEBP and MYOD) in this super-enhancer. In order to examine the relationship between this super-enhancer and gene SOX2, I go to the SEA-Browser via the links provided in the search result page or the detailed information page. In the SEA-Browser, the genetic and epigenetic context in the super-enhancer are visualized. It is shown that gene SOX2 is localized in this super-enhancer. This super-enhancer includes three CpG islands which are key regulatory regions for DNA methylation. As an important feature of super-enhancer, this super-enhancer contains a lot of transcriptional factor binding sites which are essential for the transcription regulation of gene SOX2. It should be noted that SEA-Browser provides the super-enhancer and H3K27ac modification state in all cell-type/tissue/diseases which enable us to check the cell-type/tissue/disease specific super-enhancer and H3K27ac modification. It is shown that this super-enhancer is stem cell specific and specifically enriched by H3K27ac, indicating the important roles of this super-enhancer in regulation of stem cell specifically high expression of gene SOX2. In addition, search result also provide me useful links to other gene annotation databases including NCBI Gene, GeneCards and UniProt, by which I learned more information about human gene SOX2. In short, I experienced a very good experience in SEA, and also learned new knowledge about gene SOX2 and its super-enhancer. Well Done! I hope you will like this database!
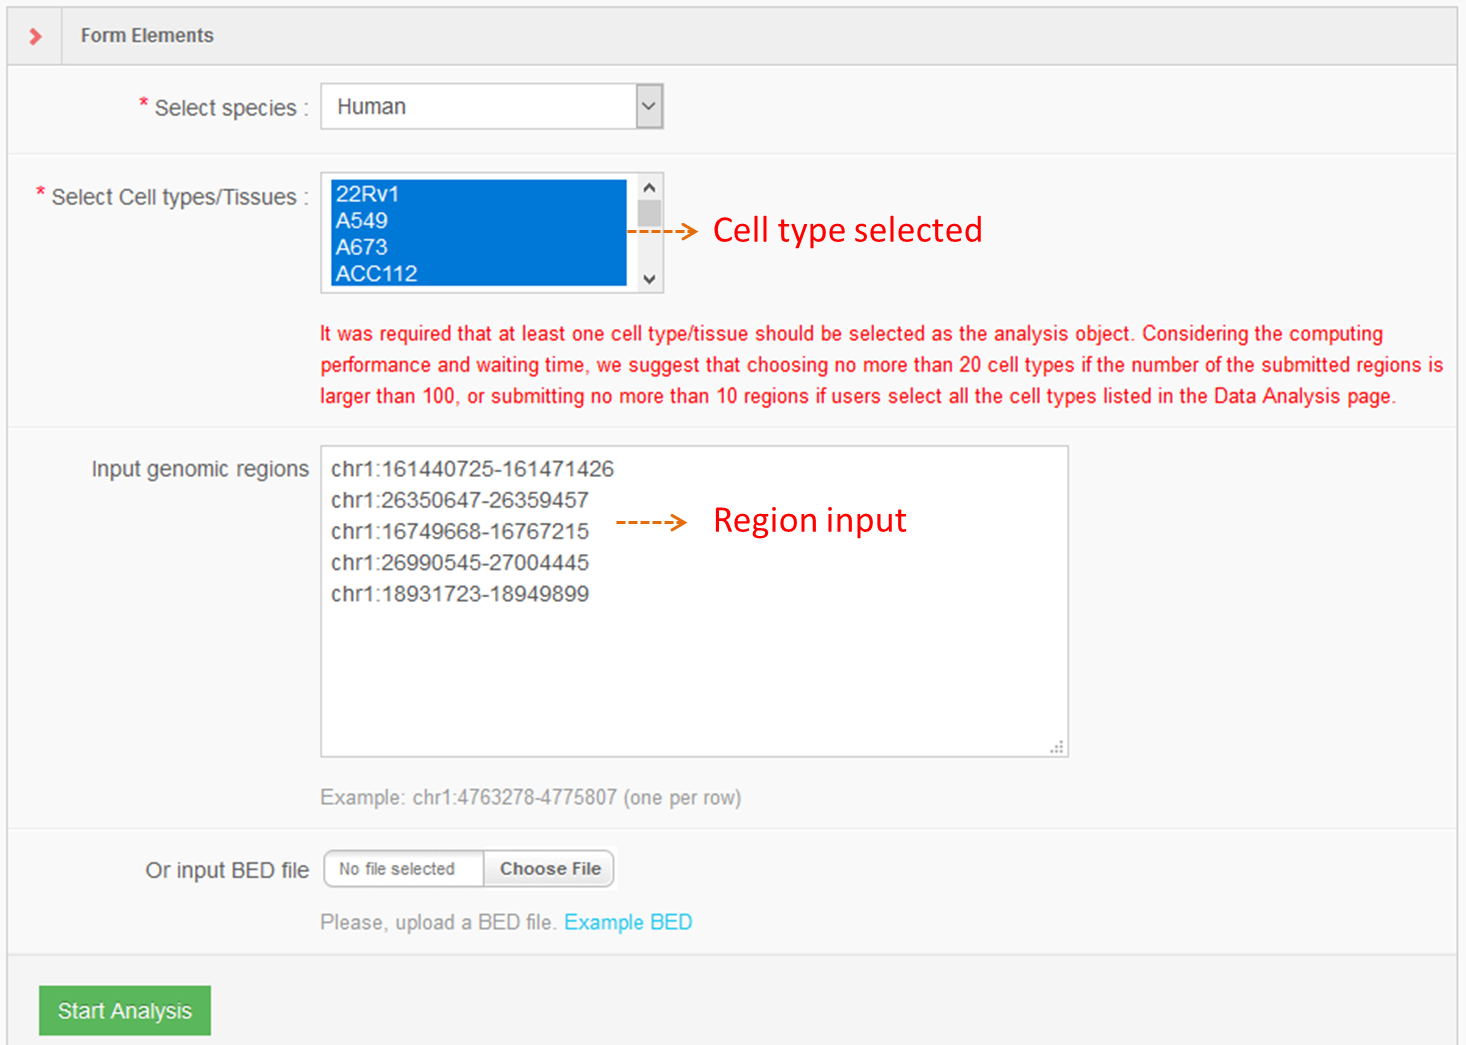
6. Online analysis tools for super-enhancers
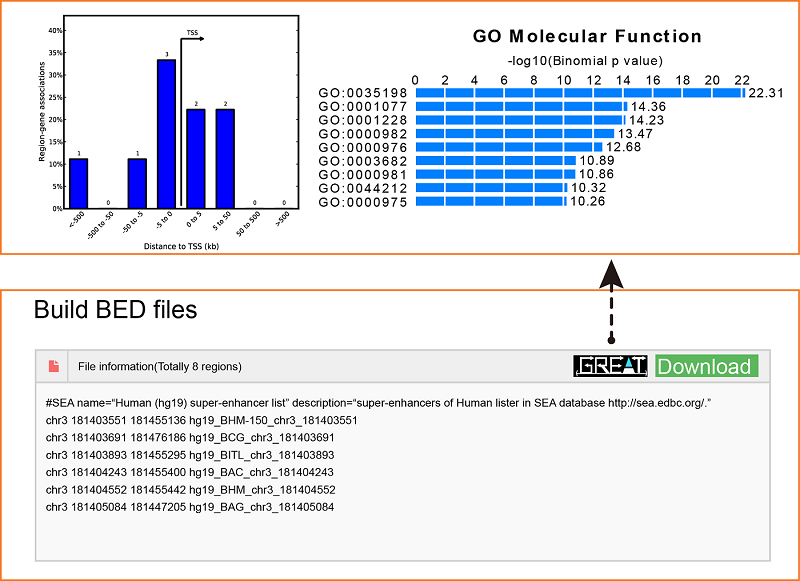
Using the advanced search for super-enhancers, users can obtain a “.bed” file (Figure 1B), which can be downloaded for future study or sent to the GREAT server (http://bejerano.stanford.edu/great/public/html/) for genomic enrichment of annotations.
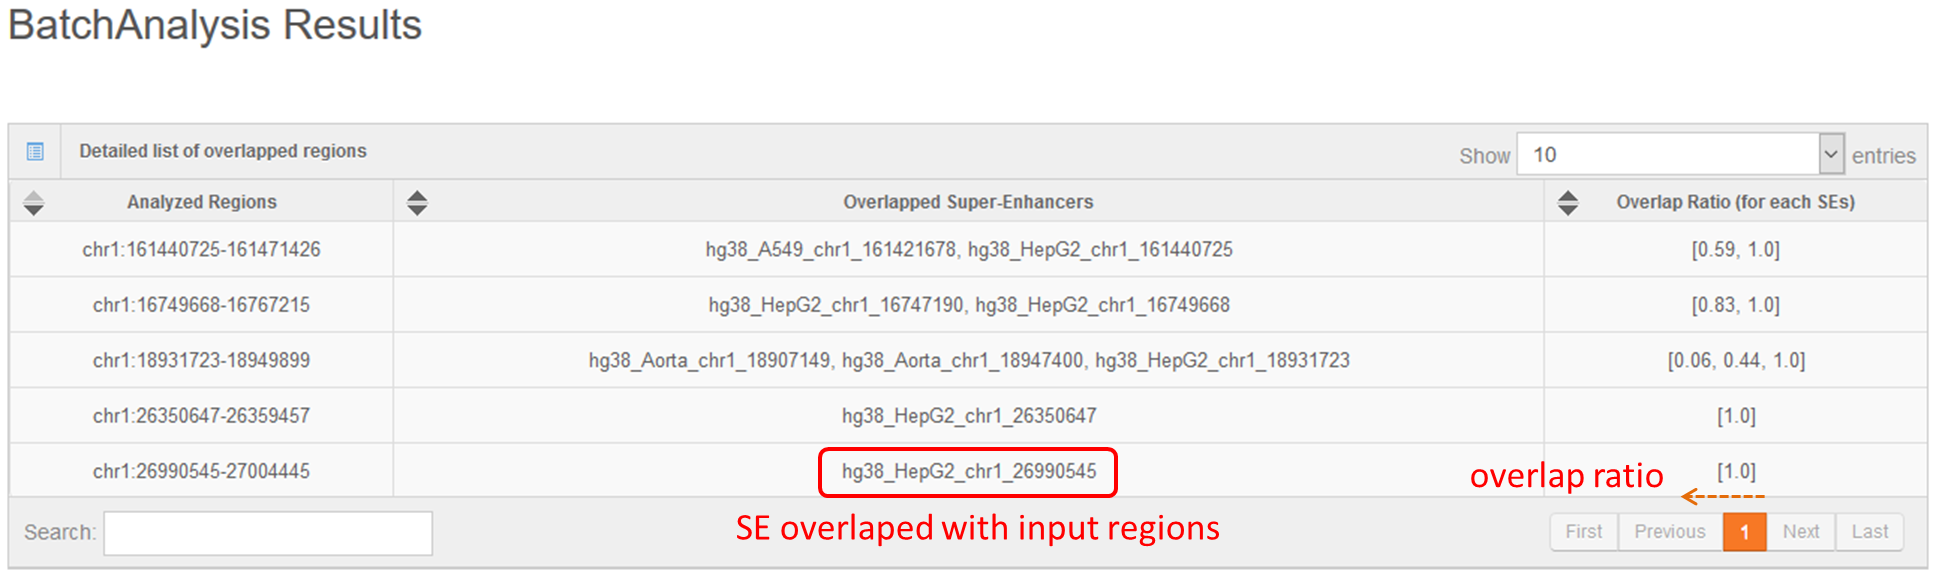
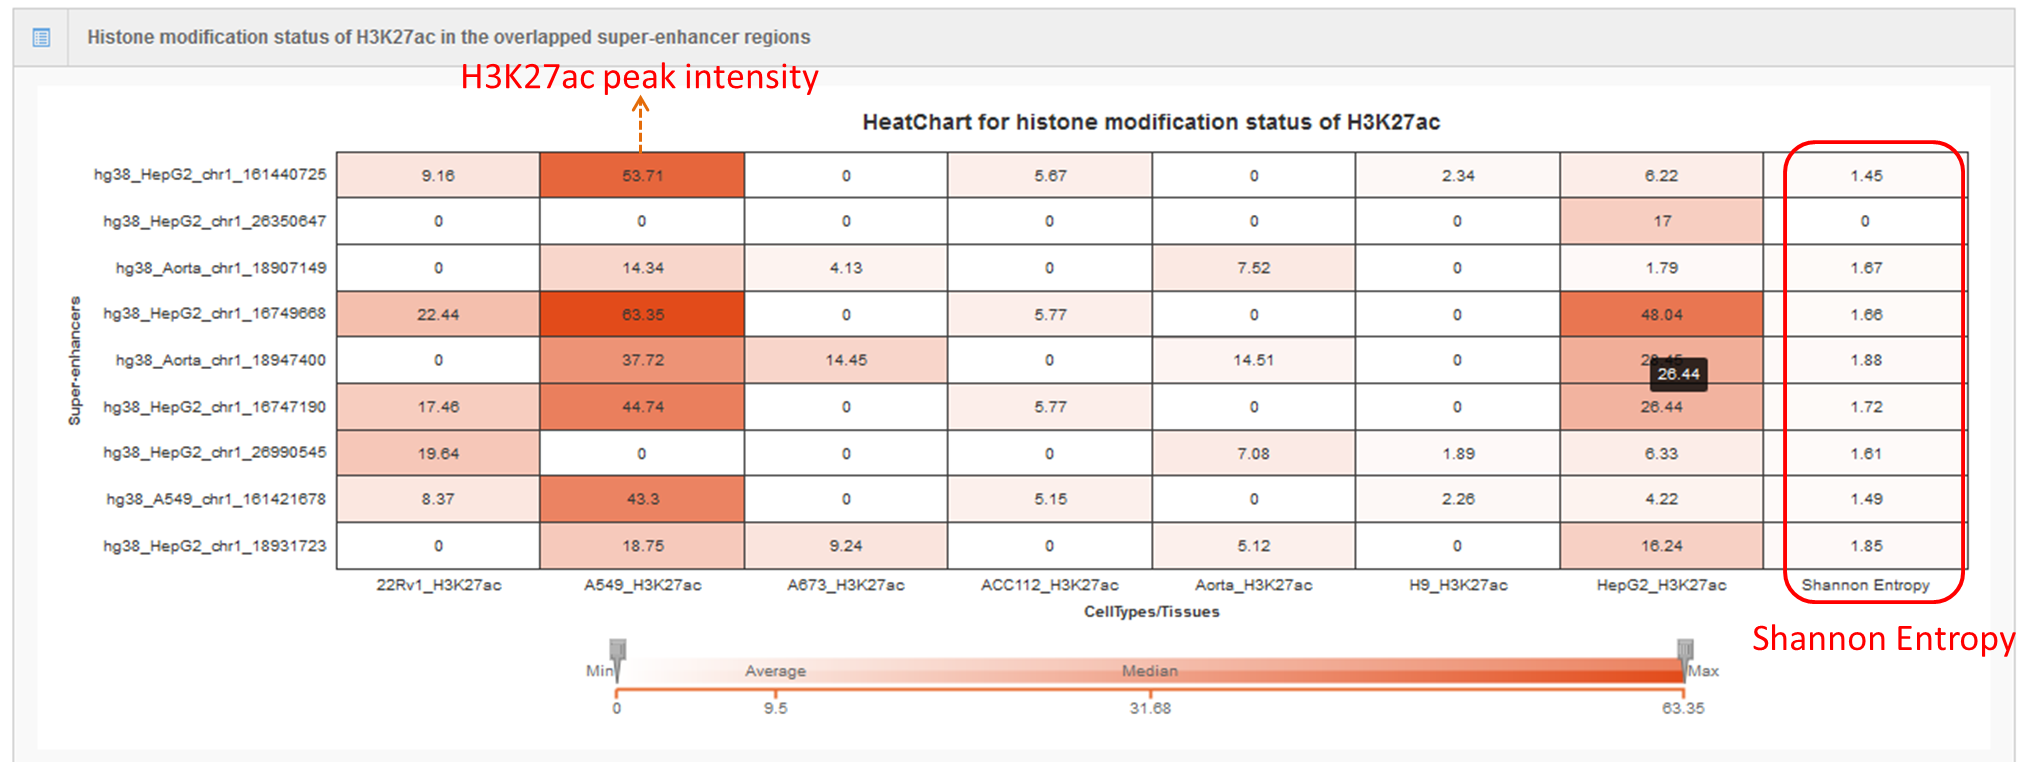
Users can also submit the genomic region(s) to SEA, which will calculate and list the overlap of the regions of interest with the current super-enhancer regions in the SEA database for downstream analysis. Simultaneously, the back-end will calculate the average H3K27ac status for each overlapping super-enhancer, and present the super-enhancer histone modification level in different cell types/tissues/diseases in a heat map.Lastly, Shannon Entropy is calculated for every SE across selected cell types. The more the value close to 0, the more specificity of the SE across selected cell types.
7. Format specification for Custom Tracks
< position > representing the initial regions for visualization.
< track > for define the custom tracks' name and detailed description.
< color > for define the custom tracks' display color.
< type > for define the custom tracks' display style, "hist" will show the custom data as peak value diagram and "region" will show the custom data as square chart.
Example 1:
OR
Example 2:
1. Table browser for datasets
2. Advance search
In this search entrance, accurate search is supported. User can specify the detailed information about super-enhancers such as species, genome location, gene name, cell-type/tissue, super-enhancer name, transcription factor etc. The results would be showed in the tables and SEA-browser.
3. Search result table
The search result would be shown in table. User can see the detail information by the links listed in this table, such as the SEID for the detailed information about nearest gene, cell-type specificity and sequence conservation. The links to SEA-browser would bring to SEA-browser for visualization of these information in genomic context.
4. SEA-browser
SEA-browser was developed for visualization of super-enhancer information in the genomic context. In SEA-browser, user can see the location of super-enhancer to nearby genes, transcriptional factor binding sites and the cell-type-specific super-enhancer and H3K27ac modification pattern. User can add or remove the data tracks by clicking the selector at the bottom of this pape.
5. A case study for analysis of human gene SOX2
Hello every one, I am Hongbo Liu. I am interested in the super-enhancer related to human gene SOX2 which coding an important transcript factor for stem cell pluripotent. In the Advance Search page, I selected human species and input “SOX2” as gene name. After clicking the Search button on the bottom, eight super-enhancers related with human SOX2 in different cell-type/tissues are list in the search result page. It is well known that SOX2 is a key gene for stem cell. Thus, I selected the super-enhancer (SEID:30459) in human stem cell H1. Clicking the blue colored SEID, the detailed information about this super-enhancer is shown in a detailed information page. As shown in this page, there are two genes (SOX2 and SOX2-OT) nearby this super-enhancer. From the network and table, we acquired that there are 5 transactional factor binding site (including the well-known super-enhancer marks CEBP and MYOD) in this super-enhancer. In order to examine the relationship between this super-enhancer and gene SOX2, I go to the SEA-Browser via the links provided in the search result page or the detailed information page. In the SEA-Browser, the genetic and epigenetic context in the super-enhancer are visualized. It is shown that gene SOX2 is localized in this super-enhancer. This super-enhancer includes three CpG islands which are key regulatory regions for DNA methylation. As an important feature of super-enhancer, this super-enhancer contains a lot of transcriptional factor binding sites which are essential for the transcription regulation of gene SOX2. It should be noted that SEA-Browser provides the super-enhancer and H3K27ac modification state in all cell-type/tissue/diseases which enable us to check the cell-type/tissue/disease specific super-enhancer and H3K27ac modification. It is shown that this super-enhancer is stem cell specific and specifically enriched by H3K27ac, indicating the important roles of this super-enhancer in regulation of stem cell specifically high expression of gene SOX2. In addition, search result also provide me useful links to other gene annotation databases including NCBI Gene, GeneCards and UniProt, by which I learned more information about human gene SOX2. In short, I experienced a very good experience in SEA, and also learned new knowledge about gene SOX2 and its super-enhancer. Well Done! I hope you will like this database!
6. Online analysis tools for super-enhancers
Using the advanced search for super-enhancers, users can obtain a “.bed” file (Figure 1B), which can be downloaded for future study or sent to the GREAT server (http://bejerano.stanford.edu/great/public/html/) for genomic enrichment of annotations.
Users can also submit the genomic region(s) to SEA, which will calculate and list the overlap of the regions of interest with the current super-enhancer regions in the SEA database for downstream analysis. Simultaneously, the back-end will calculate the average H3K27ac status for each overlapping super-enhancer, and present the super-enhancer histone modification level in different cell types/tissues/diseases in a heat map.Lastly, Shannon Entropy is calculated for every SE across selected cell types. The more the value close to 0, the more specificity of the SE across selected cell types.
7. Format specification for Custom Tracks
< position > representing the initial regions for visualization.
< track > for define the custom tracks' name and detailed description.
< color > for define the custom tracks' display color.
< type > for define the custom tracks' display style, "hist" will show the custom data as peak value diagram and "region" will show the custom data as square chart.
Example 1:
										position	chr3:181403551-181455442

										track	name="test peaks" description="super-enhancers of Huamn listed in SEA database http://sea.edbc.org/."

										color	#6600ff

										type	region

										chr3	181403551	181455136	regin name 1

										chr3	181403691	181476186	region name 2
OR
Example 2:
										position	chr3:181403551-181455442

										track	name="test peaks" description="super-enhancers of Huamn listed in SEA database http://sea.edbc.org/."

										color	#6600ff

										type	hist

										chr3	181403551	181455136	0.1

										chr3	181403691	181476186	0.3